14th Consecutive Month of y-o-y trade expansion, fifth consecutive month of export growth
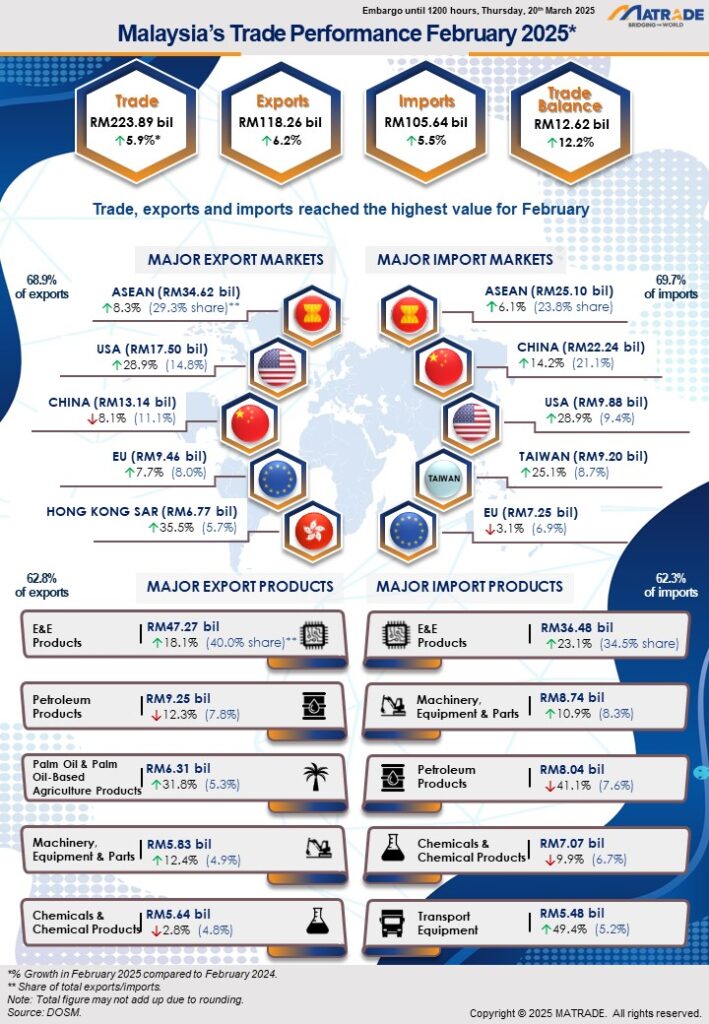
20 March 2025 – Malaysia’s trade performance maintained its positive momentum in February 2025, recording a 5.9% year-on-year (y-o-y) growth to reach RM223.89 billion. Exports rose 6.2% to RM118.26 billion while imports increased by 5.5% to RM105.64 billion.
This marked the 14th consecutive month of y-o-y trade expansion and the fifth consecutive month of export growth. Meanwhile, trade surplus rebounded to RM12.62 billion, marking the 58th consecutive month of surplus since May 2020. Trade, exports and imports also delivered the highest monthly value in history for the month of February.
Manufactured Goods Demand
The growth in exports was primarily driven by robust demand for manufactured goods, which accounted for 85.7% of total exports and expanded by 8.8% y-o-y to RM101.3 billion. A significant contributor to this increase was the export of electrical and electronic (E&E) products, which alone rose by more than RM7 billion in value. In addition, agricultural goods—particularly palm oil and palm oil-based agriculture products—also pushed export figures upward.
Surge in ICs
Malaysia’s key trading partners continued to demonstrate robust demand, with exports to ASEAN, the United States (US), the European Union (EU), and Taiwan registering positive growth, fuelled largely by the surge in demand for semiconductor devices and integrated circuits (ICs). This aligns with the 2025 global semiconductor sales growth projection of 11.2% by the World Semiconductor Trade Statistics (WSTS). Beyond traditional partners, exports to Free Trade Agreement (FTA) markets such as Mexico and Canada also posted year-on-year gains.
Upward Momentum
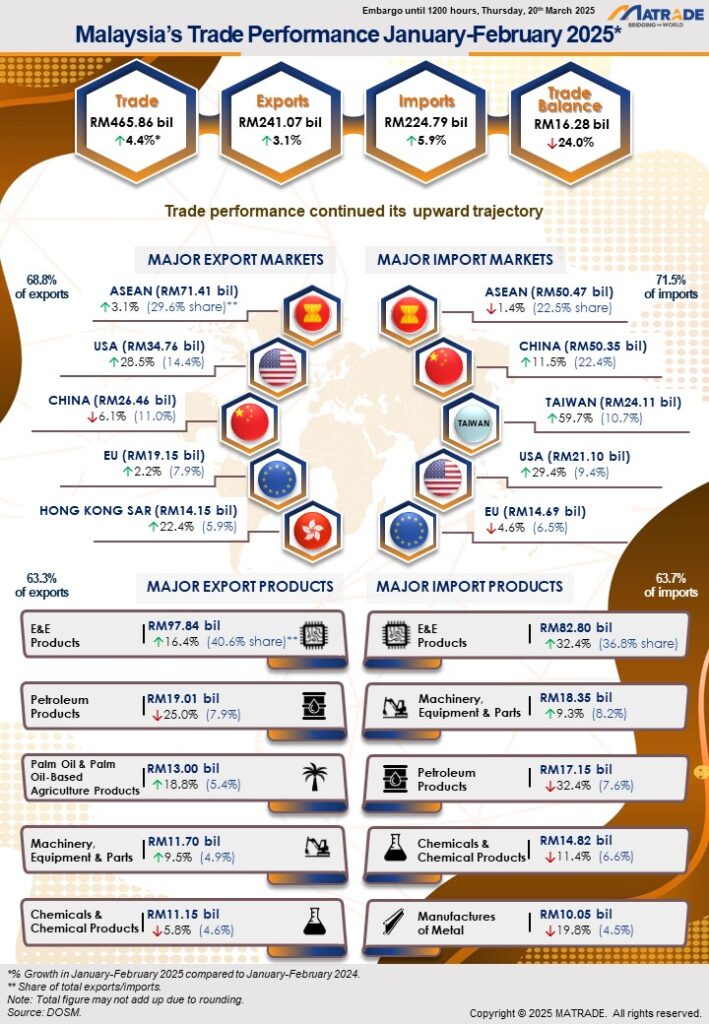
For the first two months of 2025, Malaysia’s trade performance continued its upward momentum, recording a 4.4% increase to RM465.86 billion compared to the corresponding period in 2024. Exports for the period rose by 3.1% to RM241.07 billion, while imports increased by 5.9% to RM224.79 billion, resulting in a trade surplus of RM16.28 billion. Similar to February, trade, exports, and imports all achieved record high values for the January–February period.
Export Performance of Major Sectors
In February 2025, Malaysia’s export growth was led by the manufacturing sector, which contributed 85.7% to total exports and expanded by 8.8% year-on-year to RM101.3 billion, marking the fifth consecutive month of growth. This performance was primarily driven by electrical and electronic (E&E) products, which surged by 18.1% y-o-y to RM47.27 billion, accounting for 40% of total exports. Other manufactured goods that recorded notable increases included machinery, equipment and parts (↑12.4%), optical and scientific equipment, and processed food.
Exports of agriculture goods, which made up 7.3% of total exports, rose sharply by 27.4% y-o-y to RM8.65 billion, the 11th straight month of expansion, supported by stronger demand and higher prices for palm oil and palm oil-based products. In contrast, mining goods—with a 6.1% share—declined by 33% y-o-y to RM7.23 billion, largely due to reduced volumes and prices of crude petroleum and liquefied natural gas (LNG).
Other key export products in February 2025 included:
- Petroleum products: RM9.25 billion (7.8% share), down 12.3%
- Palm oil and palm oil-based agriculture products: RM6.31 billion (5.3% share), up 31.8%
- Chemicals and chemical products: RM5.64 billion (4.8% share), down 2.8%
However, on a month-on-month (m-o-m) basis, exports of all three main sectors declined—manufactured goods fell 2.7%, agriculture goods 5.2%, and mining goods 15.2%.
For the cumulative period of January to February 2025, exports of manufactured goods rose 4.4% y-o-y to RM205.44 billion, supported by sustained global demand for E&E products, machinery, and palm oil-based manufactured items. Agriculture exports recorded a strong 18.4% growth to RM17.77 billion, driven by higher shipments of palm oil and natural rubber. Meanwhile, mining exports contracted 23.2% to RM15.75 billion, affected by weaker performance in LNG and crude petroleum.
Trade Performance with Major Markets
In February 2025, Malaysia’s trade with key partners—ASEAN, China, the United States, the European Union, and Taiwan—collectively accounted for 68.5% of total trade.
ASEAN remained Malaysia’s largest trading bloc, contributing 26.7% of total trade and expanding by 7.4% year-on-year to RM59.72 billion. Exports to ASEAN grew 8.3% to RM34.62 billion, driven by strong shipments of electrical and electronic (E&E) products, machinery, and liquefied natural gas (LNG). Imports from ASEAN also rebounded, rising 6.1% to RM25.1 billion.
Major export gains were recorded in Singapore (↑17.2% to RM18.35 billion), Thailand(↑14.7%), and Indonesia (↑8.5%), with the increases underpinned by E&E and petroleum-related products. However, exports to Viet Nam, the Philippines, Brunei, and Cambodia declined, while exports to Myanmar and Lao PDRregistered notable growth, particularly Lao PDR with a sharp rise of 191.7%.
On a month-on-month basis, ASEAN trade declined by 3.9%, with exports down 5.9% and imports easing 1.1%. For the January–February 2025 period, trade with ASEAN rose 1.2% to RM121.88 billion, with exports increasing 3.1% to RM71.41 billion, while imports fell 1.4% to RM50.47 billion.
China: Trade Improve
China, Malaysia’s second-largest trading partner, accounted for 15.8% of total trade and grew by 4.8% y-o-y to RM35.38 billion in February 2025. However, exports to China declined by 8.1% to RM13.14 billion, due to lower shipments of LNG, metal-based manufactures, and petroleum condensates. Despite the decline, there was growth in exports of petroleum products, machinery, and E&E products. Imports from China, meanwhile, surged by 14.2% to RM22.24 billion.
Compared to January 2025, Malaysia’s trade with China dropped by 14.6%, with exports declining 1.4% and imports falling 20.9%. Over the January–February 2025 period, total trade with China increased by 4.7% to RM76.81 billion. While exports slipped 6.1% to RM26.46 billion, driven by reduced shipments of LNG and petroleum-based products, imports rose significantly by 11.5% to RM50.35 billion.
The United States: Double Digit Growth for Trade, Exports and Imports
In February 2025, Malaysia’s trade with the United States accounted for 12.2% of total trade and surged by 28.9% year-on-year to RM27.38 billion, reflecting strong bilateral economic ties. Exports to the US recorded their 14th consecutive month of growth, rising by 28.9% to RM17.5 billion, supported by robust demand for electrical and electronic (E&E) products, palm oil and palm oil-based agriculture products, as well as processed food. Imports from the US also increased by 28.9% to RM9.88 billion.
On a month-on-month basis, exports rose 1.4%, while overall trade and imports declined by 3.8% and 11.9%, respectively.
For the January–February 2025 period, trade with the US expanded by 28.9% to RM55.85 billion compared to the same period last year. Exports grew by 28.5% to RM34.76 billion, driven by sustained shipments of E&E products, palm oil-based goods, and machinery and equipment. Imports rose by 29.4% to RM21.1 billion.
The EU: Trade and Exports Improved
In February 2025, Malaysia’s trade with the EU, which made up 7.5% of total trade, rose by 2.7% year-on-year to RM16.71 billion, rebounding from negative growth recorded in the previous month. Exports to the EU increased by 7.7% to RM9.46 billion, supported by higher demand for electrical and electronic (E&E) products and palm oil-based manufactured products. In contrast, imports from the EU declined by 3.1% to RM7.25 billion.
Among EU member states, Germany recorded the largest export growth, rising RM590.1 million on the back of strong E&E exports, while exports to the Netherlands increased RM59.8 million, driven by palm oil-based products. On a month-on-month basis, trade with the EU fell slightly—exports and imports both decreased by 2.4% and 2.5%, respectively.
Within the EU, the top 10 markets which accounted for 92.7% of Malaysia’s total exports to the region were:
- Germany, RM3.14 billion, increased by 23.1%, y-o-y;
- Netherlands, RM2.50 billion, ↑2.5%
- Belgium, RM686.7 million, ↓7.5%
- Spain, RM541.6 million, ↓9.1%
- Italy, RM478.2 million, ↓7.7%
- France, RM441.0 million, ↓1.0%
- Czech Republic, RM370.8 million, ↑90.6%
- Hungary, RM230.2 million, ↓19.2%
- Polland, RM229.3 million, ↓11.9%
- Sweden, RM155.3 million, ↑32.1%
For the January–February 2025 period, trade with the EU dipped slightly by 0.9% to RM33.85 billion. However, exports rose by 2.2% to RM19.15 billion, driven by continued demand for E&E and palm oil-based products, while imports declined by 4.6% to RM14.69 billion.
Taiwan: Trade, Exports and Imports Posted Expansion
In February 2025, Malaysia’s trade with Taiwan, which accounted for 6.4% of total trade, rose by 17.9% year-on-year to RM14.24 billion. Exports grew by 6.8% to RM5.05 billion, supported by increased shipments of optical and scientific equipment and electrical and electronic (E&E) products. Imports from Taiwan surged by 25.1% to RM9.2 billion, reflecting continued demand for intermediate goods.
On a month-on-month basis, trade with Taiwan saw a sharp decline, with exports down 8.8%, imports falling 38.3%, and total trade dropping 30.4%.
For the January–February 2025 period, total trade with Taiwan expanded by 43.3% to RM34.69 billion. Exports increased by 16.2% to RM10.58 billion, driven by strong demand for E&E products, optical and scientific equipment, and machinery, equipment and parts. Meanwhile, imports soared by 59.7% to RM24.11 billion.
Trade with FTA Partners
In February 2025, Malaysia’s trade with Free Trade Agreement (FTA) partners—which accounted for 63.7% of total trade—improved by 2.3% year-on-year to RM142.68 billion. Exports rebounded by 2.1% to RM77.36 billion, while imports rose by 2.5% to RM65.31 billion.
Export gains were notably strong in several FTA markets:
- Hong Kong SAR (↑35.5% to RM6.77 billion), Mexico (↑24.6% to RM1.76 billion), Canada (↑64.6% to RM587.4 million), all driven by higher E&E exports.
- Turkiye (↑18.2% to RM1.76 billion) and Chile (↑6.8% to RM53.4 million), supported by palm oil-based products.
- New Zealand (↑6.9% to RM543.7 million) and Peru (↑29.3% to RM55.2 million), bolstered by stronger processed food exports.
Compared to January 2025, trade, exports and imports contracted by 6.7%, 4.9% and 8.7%, respectively.
For the January–February 2025 period, total trade with FTA partners fell marginally by 0.3% to RM295.59 billion. While exports dipped 0.7% to RM158.7 billion, imports edged up by 0.2% to RM136.89 billion.
Import Performance
In February 2025, Malaysia’s total imports increased by 5.5% y-o-y to RM105.64 billion. The growth was driven by all three main categories of imports, which together made up 77.2% of total imports:
- Intermediate goods: RM58.73 billion (55.6% share), ↑5.8%, due to higher imports of parts and accessories for non-transport capital goods.
- Capital goods: RM13.82 billion (13.1% share), ↑35.3%, driven by increased imports of industrial transport equipment.
- Consumption goods: RM9.05 billion (8.6% share), ↑7.4%, mainly due to higher imports of processed food and beverages for household use.
Compared to January 2025, total imports fell by 11.3%, with intermediate goods down 3.3%, capital goods 30.7%, and consumption goods 10%.
For the first two months of 2025, total imports expanded by 5.9% to RM224.79 billion. This included:
- Intermediate goods: ↑4.6% to RM119.48 billion
- Capital goods: ↑41.2% to RM33.75 billion
- Consumption goods: ↑1.9% to RM19.1 billion
Commitment to Strengthen Export Performance
Despite global optimism, the pace of international trade growth may continue to face external challenges. The World Trade Organization (WTO) has projected a 3.0% growth in global trade volume for 2025, while the International Monetary Fund (IMF) forecasts a 3.2% expansion in global economic activity. However, these projections may be moderated by ongoing geopolitical developments and macroeconomic uncertainties. The Ministry of Investment, Trade and Industry (MITI), together with its trade promotion agency, MATRADE, remains committed to strengthening export performance.
Note: This is a preliminary release, full details would be published in the “MONTHLY EXTERNAL TRADE STATISTICS” report by the Department of Statistics, Malaysia, to be disseminated on Friday, 28th March 2025 and can be downloaded through statistic at the Department of Statistics, Malaysia’s portal (https://newss.statistics.gov.my/newss-portalx/ep/epLogin.seam).